File list
From ift
This special page shows all uploaded files.
| Date | Name | Thumbnail | Size | User | Description | Versions |
|---|---|---|---|---|---|---|
| 11:58, 22 September 2011 | Ch8.pdf (file) | 2.47 MB | Gge002 (talk | contribs) | The Radio Sky and How to Observe It - by Jeff Lashley Ch.8 | 1 | |
| 11:57, 22 September 2011 | Ch7.pdf (file) | 1.66 MB | Gge002 (talk | contribs) | The Radio Sky and How to Observe It - by Jeff Lashley Ch.7 | 1 | |
| 11:57, 22 September 2011 | Ch6.pdf (file) | 1.57 MB | Gge002 (talk | contribs) | The Radio Sky and How to Observe It - by Jeff Lashley Ch.6 | 1 | |
| 11:57, 22 September 2011 | Ch5.pdf (file) | 2.65 MB | Gge002 (talk | contribs) | The Radio Sky and How to Observe It - by Jeff Lashley Ch.5 | 1 | |
| 11:46, 22 September 2011 | Ch4.pdf (file) | 1.74 MB | Gge002 (talk | contribs) | The Radio Sky and How to Observe It - by Jeff Lashley Ch.4 | 1 | |
| 11:46, 22 September 2011 | Ch3.pdf (file) | 4.05 MB | Gge002 (talk | contribs) | The Radio Sky and How to Observe It - by Jeff Lashley Ch.3 | 1 | |
| 11:46, 22 September 2011 | Ch2.pdf (file) | 2.27 MB | Gge002 (talk | contribs) | The Radio Sky and How to Observe It - by Jeff Lashley Ch.2 | 1 | |
| 11:45, 22 September 2011 | Ch1.pdf (file) | 1.86 MB | Gge002 (talk | contribs) | The Radio Sky and How to Observe It - by Jeff Lashley Ch.1 | 1 | |
| 06:41, 22 September 2011 | Jupiter3.jpg (file) |  |
46 KB | Gge002 (talk | contribs) | Jupiter - A-, B- and C type radio bursts | 1 |
| 06:40, 22 September 2011 | Jupiter2.jpg (file) |  |
103 KB | Gge002 (talk | contribs) | Jupiter radio frequency emissions | 1 |
| 06:39, 22 September 2011 | Jupiter1.jpg (file) |  |
121 KB | Gge002 (talk | contribs) | Particle trajectory in Jupiter's magnetic fieald | 1 |
| 21:08, 21 September 2011 | ParaboloidConcentrator.pdf (file) | 144 KB | Gge002 (talk | contribs) | 1 | ||
| 08:54, 30 August 2011 | SelectMAP Kernel Module.pdf (file) | 1.94 MB | Nfyku (talk | contribs) | 1 | ||
| 12:39, 29 August 2011 | P-n junctions.pdf (file) | 1.39 MB | Nfyku (talk | contribs) | Elementary Physics of P-N Junctions | 1 | |
| 12:19, 27 June 2011 | UDMOverview2.pdf (file) | 681 KB | Jli051 (talk | contribs) | Talk given at Fysikermøtet 2011, University of Oslo | 1 | |
| 16:32, 13 May 2011 | Pattern test.svf.txt (file) | 1 KB | Sya081 (talk | contribs) | 1 | ||
| 13:04, 12 May 2011 | Focal readout.pdf (file) | 1.87 MB | Sya081 (talk | contribs) | 1 | ||
| 12:58, 12 May 2011 | Svf xilinx.pdf (file) | 372 KB | Sya081 (talk | contribs) | 1 | ||
| 12:58, 12 May 2011 | Svf specification.pdf (file) | 85 KB | Sya081 (talk | contribs) | 1 | ||
| 12:54, 12 May 2011 | ML605.ucf.txt (file) | 47 KB | Sya081 (talk | contribs) | 1 | ||
| 12:50, 12 May 2011 | U1.vhdl.txt (file) | 20 KB | Sya081 (talk | contribs) | 1 | ||
| 12:50, 12 May 2011 | U2.vhdl.txt (file) | 20 KB | Sya081 (talk | contribs) | 1 | ||
| 12:46, 12 May 2011 | U2.ucf.txt (file) | 28 KB | Sya081 (talk | contribs) | 1 | ||
| 12:34, 12 May 2011 | U1.ucf.txt (file) | 27 KB | Sya081 (talk | contribs) | 1 | ||
| 11:57, 12 May 2011 | Mimosa.bsd.txt (file) | 5 KB | Sya081 (talk | contribs) | 1 | ||
| 08:38, 12 April 2011 | Focal read-out board schematics.pdf (file) | 6.05 MB | Sya081 (talk | contribs) | 2 | ||
| 08:35, 12 April 2011 | PH1-UserMan-20080916.pdf (file) | 2.27 MB | Sya081 (talk | contribs) | 1 | ||
| 10:04, 19 January 2011 | LabView2.png (file) |  |
2 KB | Gge002 (talk | contribs) | Traced connection of a function to a tunnel in the structure border | 1 |
| 10:03, 19 January 2011 | LabView1.png (file) |  |
2 KB | Gge002 (talk | contribs) | Function connected directly to a structure, seemingly without a tunnel or shift register. | 1 |
| 10:22, 29 November 2010 | Flowchart.png (file) |  |
52 KB | Asa022 (talk | contribs) | Figure 6: Flowchart of the DAQ | 1 |
| 10:20, 29 November 2010 | Fibremount2.png (file) |  |
70 KB | Asa022 (talk | contribs) | Figure 3: Sketch and picture of the fibremount that holds a multi-channel fibre above an ocular | 1 |
| 10:20, 29 November 2010 | Start sketch.png (file) |  |
34 KB | Asa022 (talk | contribs) | Figure 1: Sketch of the XY-table | 1 |
| 09:48, 29 November 2010 | Start sketch.pdf (file) | 26 KB | Asa022 (talk | contribs) | Figure 1: Sketch of the XY-table | 1 | |
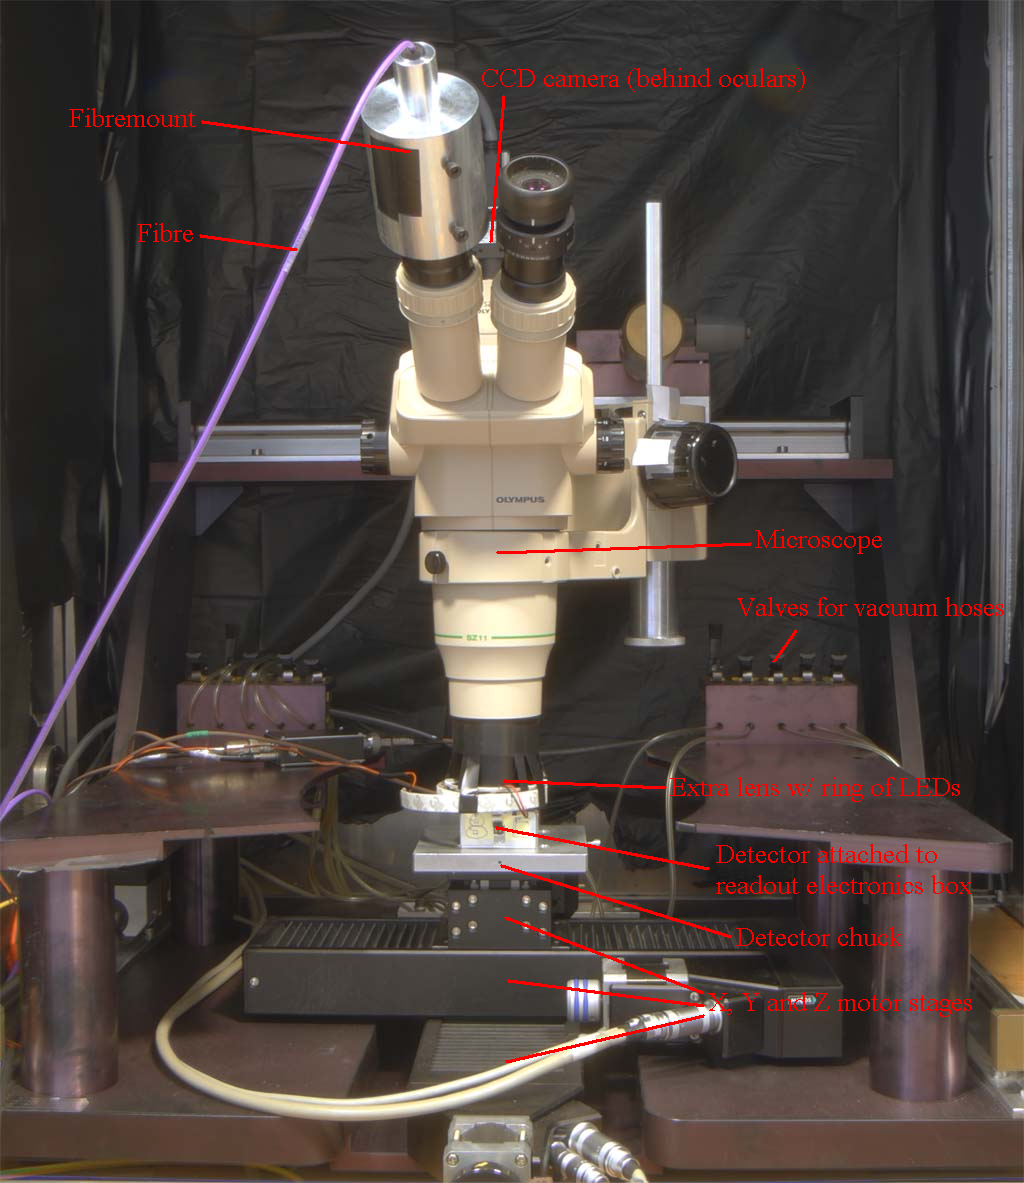
| 09:47, 29 November 2010 | Setup with text.PNG (file) |  |
1.38 MB | Asa022 (talk | contribs) | Figure 2: Picture of the XY-table set-up | 1 |
| 09:45, 29 November 2010 | Position Flash front panel.PNG (file) |  |
99 KB | Asa022 (talk | contribs) | Figure 4: Front panel of "position flash.vi" that calibrates and initialises the XY-table. Here the red flash point coincides with the flash at the upper left corner, and it is selected as origin. Notice that the axis of the image is parallel to the MPPC pixel array. | 1 |
| 09:44, 29 November 2010 | Place Coords front panel.PNG (file) |  |
152 KB | Asa022 (talk | contribs) | Figure 5: Front panel of Place coords 50C MPPC.vi. The program recognises the upper left pixel and draws a cross at its center, while the flash point is located to the upper right side of the pixel. The outer red square is the search area. The program will only search for matching pixels inside the search area. | 1 |
| 09:43, 29 November 2010 | Flowchart.pdf (file) | 22 KB | Asa022 (talk | contribs) | Figure 6: Flowchart of the DAQ | 1 | |
| 09:42, 29 November 2010 | Fibremount2.pdf (file) | 110 KB | Asa022 (talk | contribs) | Figure 3: Sketch and picture of the fibremount that holds a multi-channel fibre with a ST-connector above an ocular | 1 | |
| 14:48, 14 September 2010 | BusyBoxUserGuide.pdf (file) | 2.27 MB | Nfyku (talk | contribs) | 1 | ||
| 14:38, 14 September 2010 | Master Thesis by Andreas Tefre Samnøy.pdf (file) | 13.22 MB | Dfe002 (talk | contribs) | Master Thesis by Andreas Tefre Samnøy | 1 | |
| 12:46, 14 September 2010 | Characterization of Scintillation Crystals for Positron Emission Tomography.pdf (file) | 10.43 MB | Jsa038 (talk | contribs) | The main purpose of this thesis has been to characterize BGO and LYSO crystals of different sizes with respect to decay time and energy resolution. BGO crystals have been used as a reference material. The work presented here is part of a research project initiated by the Department of Physics and Technology, University of Bergen, and the Department of Radiology, Haukeland University Hospital. The project is entitled “Improved diagnostics in Positron Emission Tomography (PET) through the extraction of temporal characteristics from detector system and tissue.” The main objective of the project is to use temporal information to improve sensitivity and specificity in imaging with PET technology. For the BGO crystals, a decay time of 305 +/- 6 ns has been found. The energy resolution measured with the use of the best optical grease was 16.6 +/- 0.1%. Ten small (2x2x16 mm3) LYSO crystals have been found to have a decay time of 47.0 +/- 0.3 ns. The best obtained energy resolution for these crystals is 13.3 +/- 0.2%. The larger crystals generally show a somewhat longer decay time. The 5x5x20 mm3 crystals show decay times of 48.0 to 48.5 ns. Of the crystal sizes tested, the 5x5x20 mm3 crystals show the best energy resolution. With the use of optical grease, an energy resolution of 11.4 +/- 0.1% has been measured. The linearity of the energy spectra has been investigated by the use of two different radioactive sources with a total of three different energy peaks. The linearity is very good both for the BGO and LYSO crystals. A qualitative investigation of the interaction efficiency of LYSO crystals of different sizes has been performed. The number of counts in the photopeak is compared to the total number of counts in the spectrum. No apparent difference is found increasing crystal length. The thickness of the crystal influences the interaction efficiency greatly. In addition to the characterization of different crystals, an introductory experiment concerning the rate of single, random, and true counts as a function of the activity has been performed in the PET scanner at the PET centre at Haukeland University Hospital (HUH). | 1 | |
| 11:56, 14 September 2010 | Lønne MAPD3-N.pdf (file) | 11.54 MB | Plo054 (talk | contribs) | The objective of this thesis was to characterize the MAPD3-N photodetector from Zecotek Photonics. The main parameters that have been characterized are the Absolute Gain, Photon Detection Efficiency (PDE) or spectral response, Dark current and the gain as a function of the temperature and bias voltage of the detector. | 1 | |
| 08:49, 4 June 2010 | Thesis Maeland.pdf (file) | 6.42 MB | Jma049 (talk | contribs) | Theories that include extra dimension, may change the Planck scale to the order of the electroweak symmetry breaking scale. This may allow for the creation of black hole and string balls at particle physics experiments, like those at the Large Hadron Collider. The decay of black holes and sting balls will have unique signatures, that allows us to discover them. The main focus for this thesis have been to studying the decay of simulated black holes and string balls. Where we have been focusing on methods to remove standard model backgrounds from our signal selection. If black hole and string balls are able to be produced at the Large Hadron Collider, we conclude that ATLAS will have great discovery potential for black holes and string balls. | 1 | |
| 07:07, 2 June 2010 | Masteroppgave Olausen.pdf (file) | 705 KB | Aaa014 (talk | contribs) | 1 | ||
| 14:04, 1 June 2010 | Thesis Svandal.pdf (file) | 1.39 MB | Aaa014 (talk | contribs) | The ATLAS working group has defined some safe variables that is well understood at the ATLAS early data taking. With these safe variables they have developed some safe cuts by using TMVA, that removes approximatly 70%(Loose), 50%(Medium), and 30%(Tight) of the signal. In this thesis I have made a likelihoodfunction based on the safe variables, figure 4.19, if we make cuts on this likelihood we manage to keep the same amount of signal while we reject more background than the safe cuts do. As shown in table 4.2 a cut on this likelihoodfunction will reject 5 times more background than the loose cut, and 2 times more background than the medium cut. This means that it can be a good idea to use those likelihoodcuts instead of using the safe cuts. | 1 | |
| 12:05, 1 June 2010 | Masteroppgave.pdf (file) | 705 KB | Aaa014 (talk | contribs) | Hensikten med denne masteroppgaven er aa lage en laboratorieveiledning til en o�velse i et fag for laveregradstudenter ved Universitetet i Bergen. Foruten aa fi�nne en interessant fysisk verdi er hovedhensikten at studentene skal laere behandle resultatene paa en hen- siktsmessig maate. Dette innebaerer blant annet aa behandle usikkerheter, aa �finne en verdi som representerer hele maaleserien og aa kunne vise resultatene paa en god maate. O�velsen gaar ut paa aa maale forholdet mellom elektronets ladning og masse, e/m, med et katodestraalero�r. I forarbeidet blir tre metoder pro�vd ut; avb�oyning av elektroner i et magnetisk felt der en verdi av avb�oyningen bestemmer radiusen, ingen avbo�yning ved kryssede E-og B-felt og avbo�yning i magnetisk felt der flere punkter blir benyttet for aa estimere radiusen. Den sistnevnte metoden gaar ut paa aa estimere sirkelbanen og dens sentrum ved hjelp av min- imalisering av chikvadratet. Denne viste seg aa bryte sammen. Kun resultatene fra den fo�rste metoden inneholdt den kjente verdien av forholdet innenfor usikkerhetsintervallet, men usikkerheten var kun en sto�rrelsesorden lavere enn verdien for forholdet. Maalingene var veldig avhengig av usikkerheten i avlesningen av y-verdiene og denne usikkerheten kunne vaert forminsket ytterligere. Den andre metoden hadde lavere usikkerhet, men inneholdt ikke den kjente verdien i usikkerhetsintervallet. Denne metoden hadde ogsaa noen utfordringer knyttet til innsamlingen av data. Derfor blir kun den f�orste meto- den gjennomgaatt i laboratorieveiledningen. Denne blir utformet med en generell teoridel som skal gj�ore studentene mentalt forberedt paa det de skal laere og den inneholder en utf�orelsesdel som skal fungere som et stillas for studentene. Der staar det hint om hvordan �ovelsen kan gjennomf�ores og sp�orsmaal til diskusjon som skal besvares. | 1 | |
| 11:20, 1 June 2010 | Thesis aasvold.pdf (file) | 1.28 MB | Aaa014 (talk | contribs) | Neutrinos escaping detection is one of the main problems in mass reconstruction with tau leptons. They must be neglected or corrected for in some way. This thesis discusses two methods of handling the neutrinos in different ways. The Collinear Approximation (CA) builds upon the assumption that the neutrinos travel in the same direction as the visible tau decay products. The boost method neglects the neutrino energy contribution in the leading visible tau, as seen from the mother particle's reference system. The methods have been studied with simulated \Z°→τ+τ- , \H°→τ+τ-, and QCD samples, and with early data from ATLAS. This work shows that the weaknesses of CA is that the transverse angle of the transverse missing energy has to lie between the transverse angle of the two visible taus, and that it collapses with back-to-back taus in the transverse plane. A strength of the CA is that it uses the missing energy, which is all information available about the neutrinos. The CA works better for boosted taus, i.e. taus decaying from heavy particles, like H° and Z°. The weaknesses of the boost method are that it does not use the transverse missing energy information, and that the distribution is not easily fitted, but the method is still under development on these points. The strength of the boost method is that it works for all tau pairs, making it a good complimentary method to the CA. Both methods work in \Z°→τ+τ- and \H°→τ+τ- events, and can be potentially applied to other decay chains as well. In the future, many studies will include mass reconstruction from tau leptons, where both the CA and the boost method will be important methods. | 1 | |
| 15:36, 12 March 2010 | Setup Trace Properties.png (file) |  |
11 KB | Nfyku (talk | contribs) | 1 | |
| 15:36, 12 March 2010 | Setup LVS.png (file) |  |
14 KB | Nfyku (talk | contribs) | 1 | |
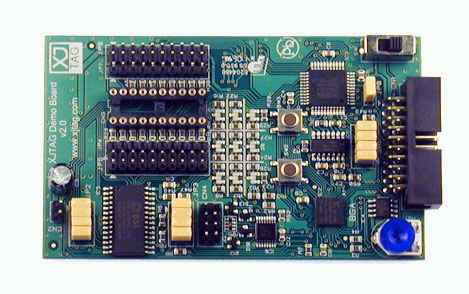
| 08:51, 10 March 2010 | XJDemo v2.0.png (file) |  |
139 KB | Nfyku (talk | contribs) | 1 |

